
Shiny Apps server
Collection of Shiny Apps developed at VIB
VIB Nucleomics Core
BNX_viewer
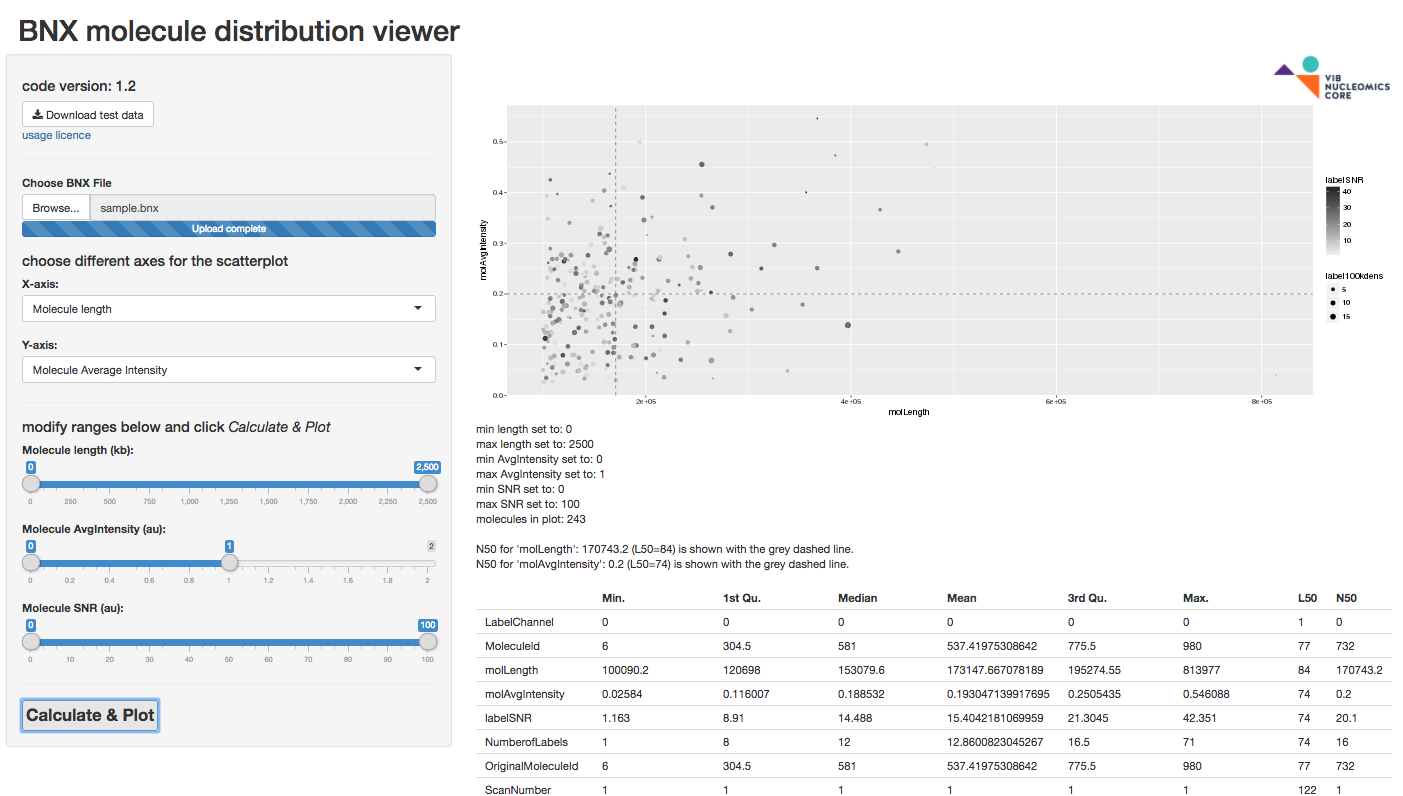
The BNX_viewer app loads BNX data from a file and creates scatterplots or histograms with filtering (no export at this point, one can easily use built-in functions for that purpose). A sample BNX file can be downloaded from the App for testing.
The BNX_viewer app loads BNX data from a file and creates scatterplots or histograms with filtering (no export at this point, one can easily use built-in functions for that purpose). A sample BNX file can be downloaded from the App for testing.
RNASeqFiltering
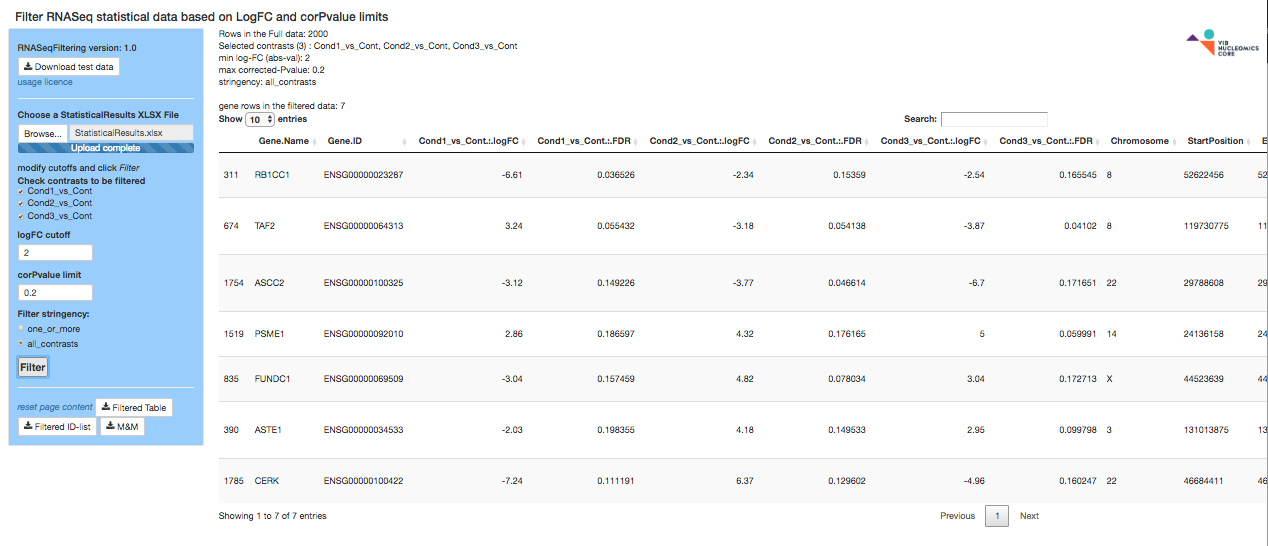
The RNASeqFiltering app loads a StatisticalResults.xlsx Excel file provided by the Nucleomics Core and filters it on one or more contrasts with chosen FDR and logFC limits. It then saves the results to XLSX and text files for further use. A sample ZIP file is present for your convenience.
The RNASeqFiltering app loads a StatisticalResults.xlsx Excel file provided by the Nucleomics Core and filters it on one or more contrasts with chosen FDR and logFC limits. It then saves the results to XLSX and text files for further use. A sample ZIP file is present for your convenience.
fpkm2heatmap
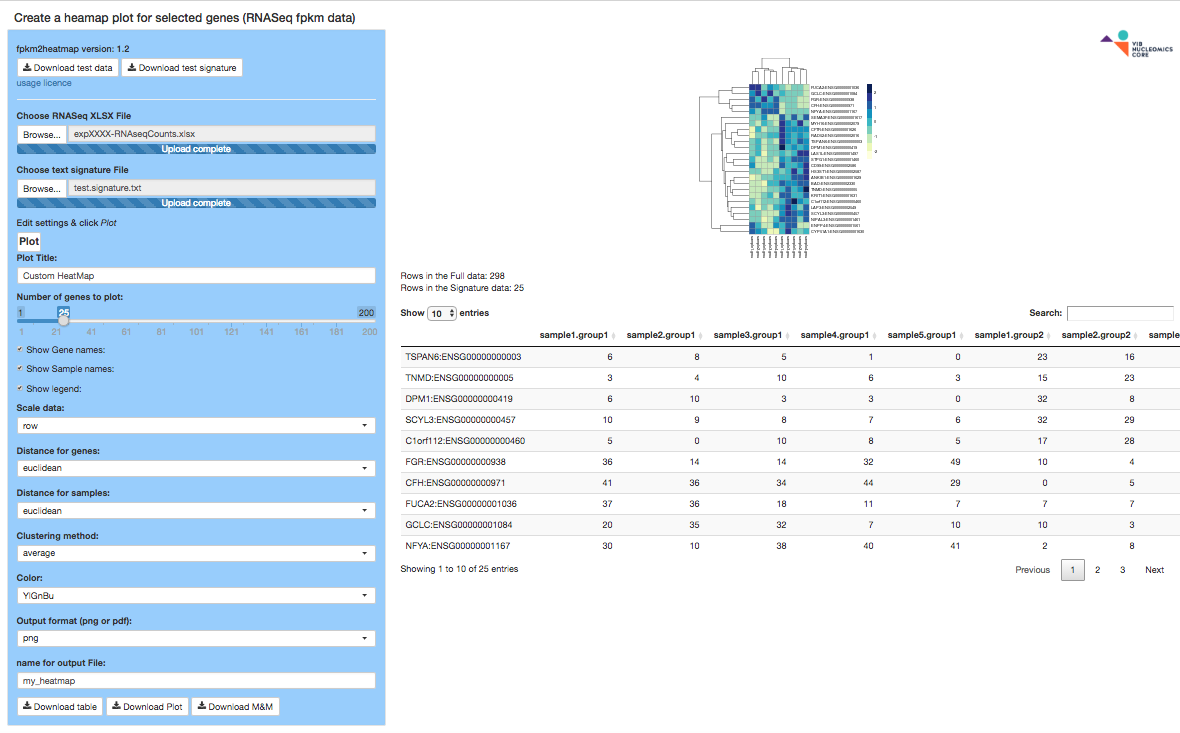
The fpkm2heatmap app loads a FPKM Excel file provided by the Nucleomics Core and a list of EnsEMBL gene IDs (signature) and produce a heatmap plot that can be tuned to your needs. A sample ZIP file is present for your convenience.
The fpkm2heatmap app loads a FPKM Excel file provided by the Nucleomics Core and a list of EnsEMBL gene IDs (signature) and produce a heatmap plot that can be tuned to your needs. A sample ZIP file is present for your convenience.
martGO2list
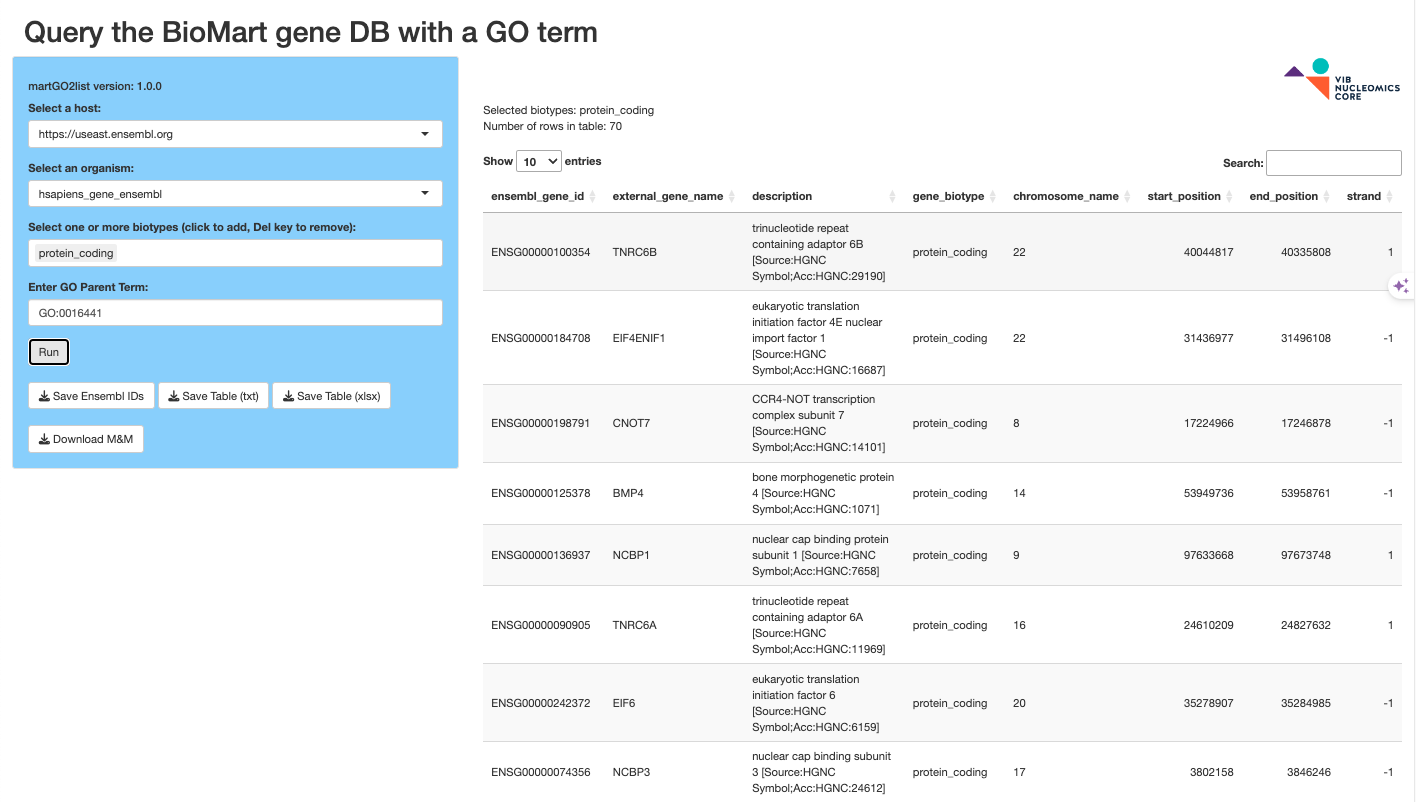
The martGO2list app takes an organism and a GO:term and returns a table of associated genes from BioMart. This list can be used with fpkm2heatmap to produce a nice biological process or pathway heatmap of your RNASeq FPKM results.
The martGO2list app takes an organism and a GO:term and returns a table of associated genes from BioMart. This list can be used with fpkm2heatmap to produce a nice biological process or pathway heatmap of your RNASeq FPKM results.
PCA_ShinyApp
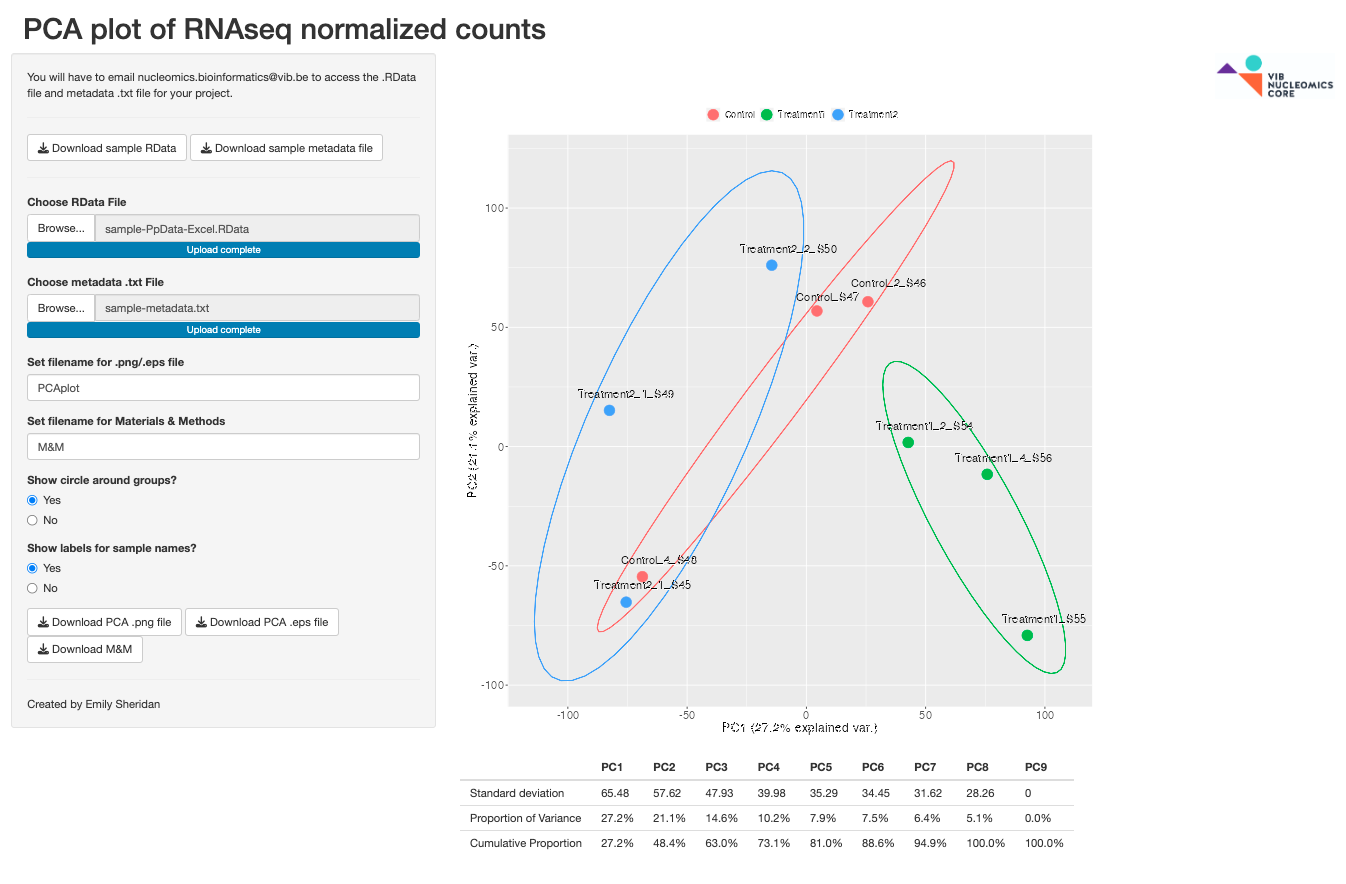
Performs PCA from a .RData and metadata.txt RNASeq analysis file obtained from the Nucleomics Core and produces exportable images.
Performs PCA from a .RData and metadata.txt RNASeq analysis file obtained from the Nucleomics Core and produces exportable images.
RFilterRNASeq
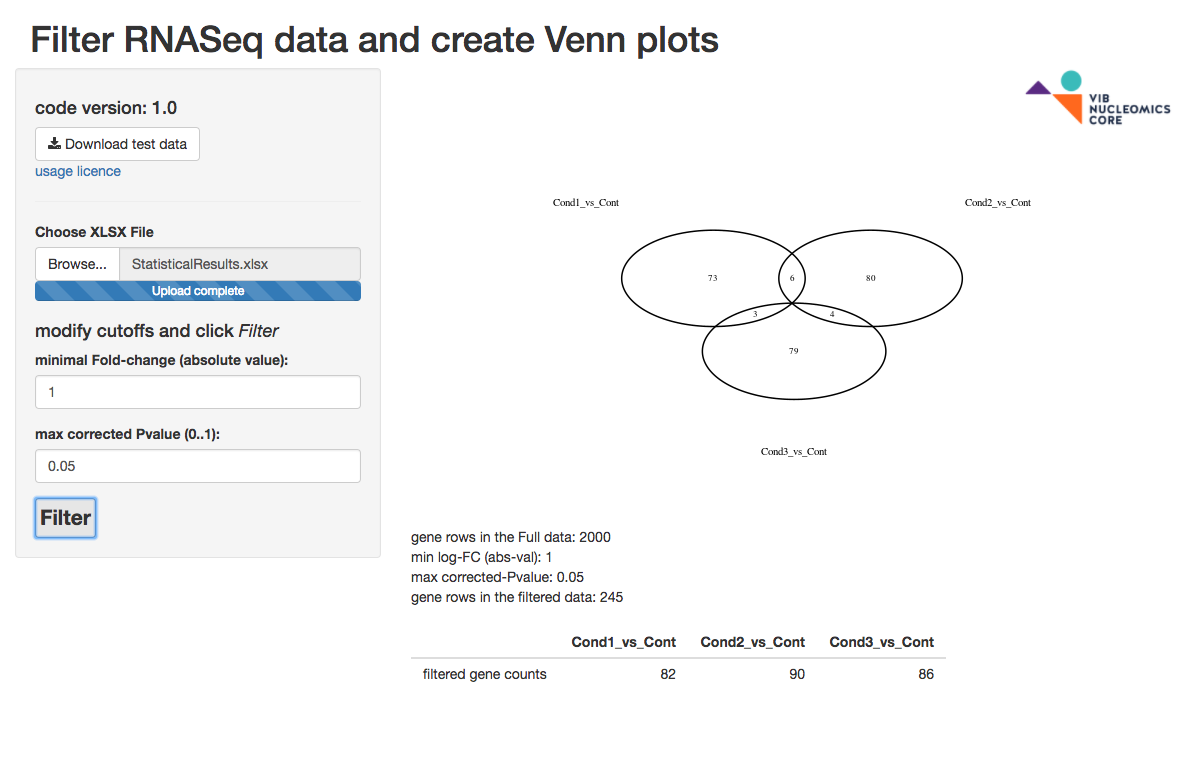
The RFilterRNASeq app loads a StatisticalResults.xlsx file obtained from the Core, filters each contrast based on user input, and creates a Venn plot and a count table. The Venn plot supports up to 5 contrasts and is not created beyond that. A sample excel file with 2000 gene rows is present for your convenience.
The RFilterRNASeq app loads a StatisticalResults.xlsx file obtained from the Core, filters each contrast based on user input, and creates a Venn plot and a count table. The Venn plot supports up to 5 contrasts and is not created beyond that. A sample excel file with 2000 gene rows is present for your convenience.
RBioanalyzer
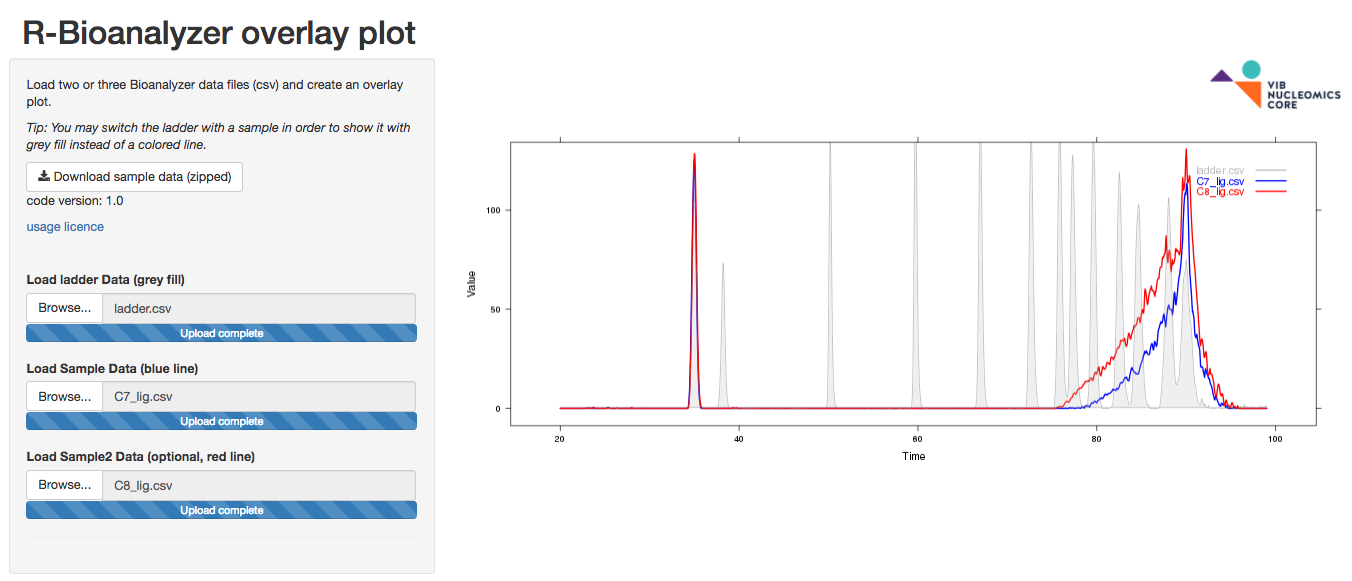
The RBioanalyzer app loads 2 to 3 Bioanalyzer exported csv files and creates an overlay plot. A sample file is present for your convenience.
The RBioanalyzer app loads 2 to 3 Bioanalyzer exported csv files and creates an overlay plot. A sample file is present for your convenience.
assemblyNplot
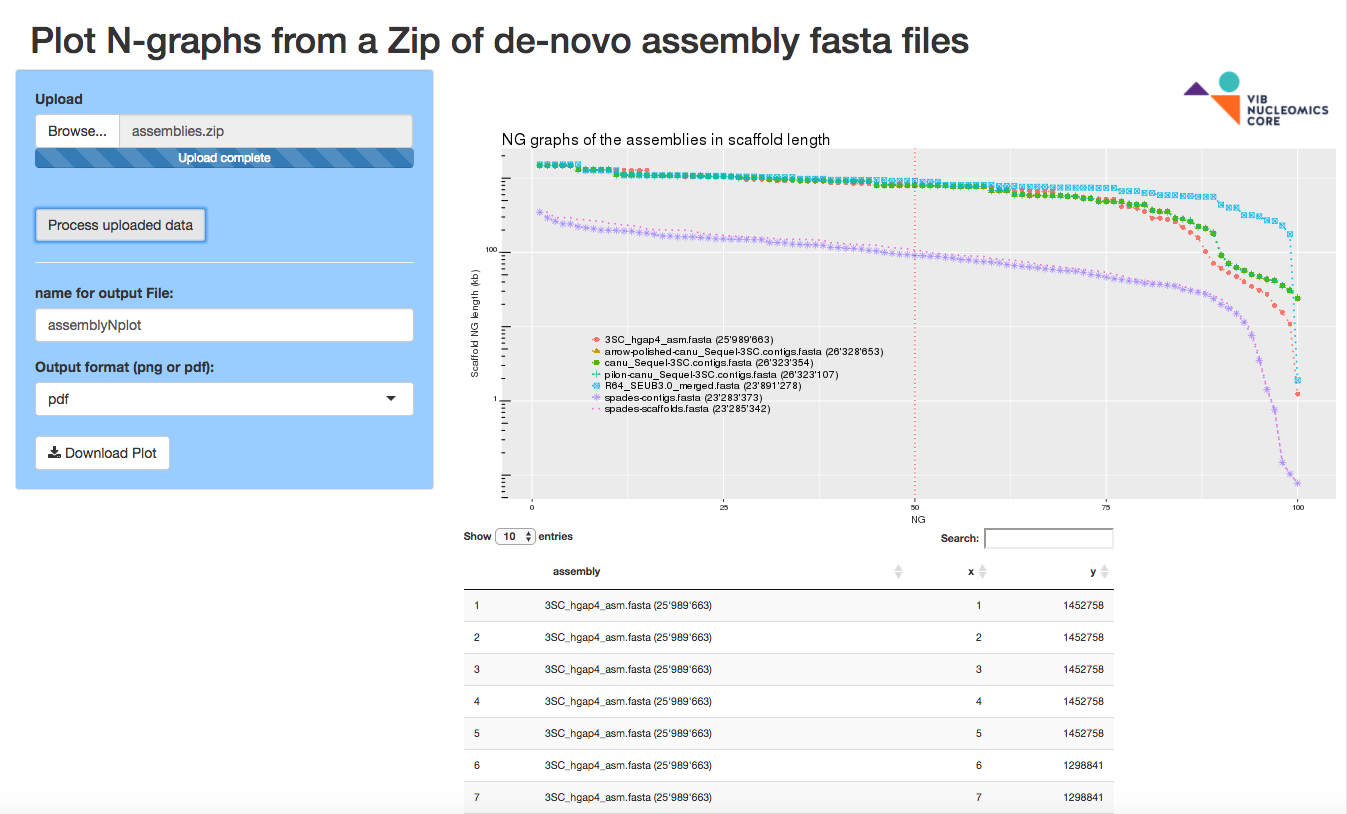
The assemblyNplot app plots N-graphs from a zip of fasta genome assemblies (one or more fasta files).
The assemblyNplot app plots N-graphs from a zip of fasta genome assemblies (one or more fasta files).
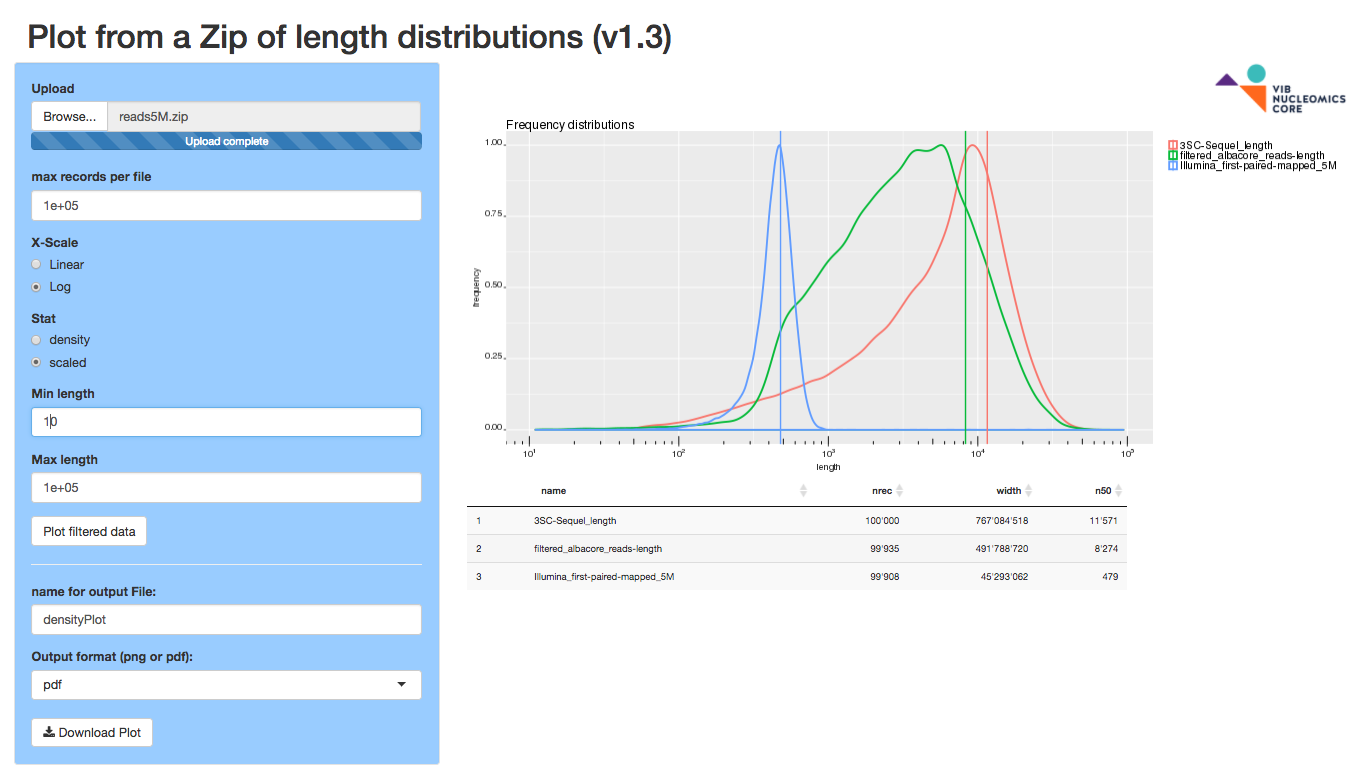
multiLengthplot
The multiLengthplot app plots length densities from a zip of text files reporting lengths (eg. lengths of fasta records or whatever length you can measure, one or more text files). A sample file is present for your convenience.
The multiLengthplot app plots length densities from a zip of text files reporting lengths (eg. lengths of fasta records or whatever length you can measure, one or more text files). A sample file is present for your convenience.
This work is licensed under a Creative Commons Attribution-ShareAlike 3.0 Unported License.
Please send comments and feedback to nucleomics.bioinformatics@vib.be.
Source code available at GitHub.


Please send comments and feedback to nucleomics.bioinformatics@vib.be.
Source code available at GitHub.